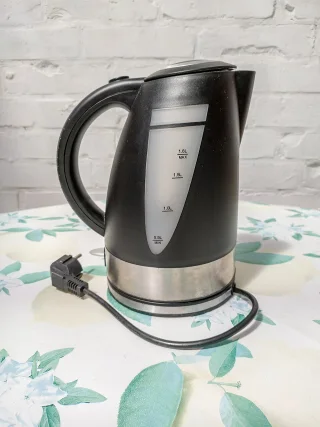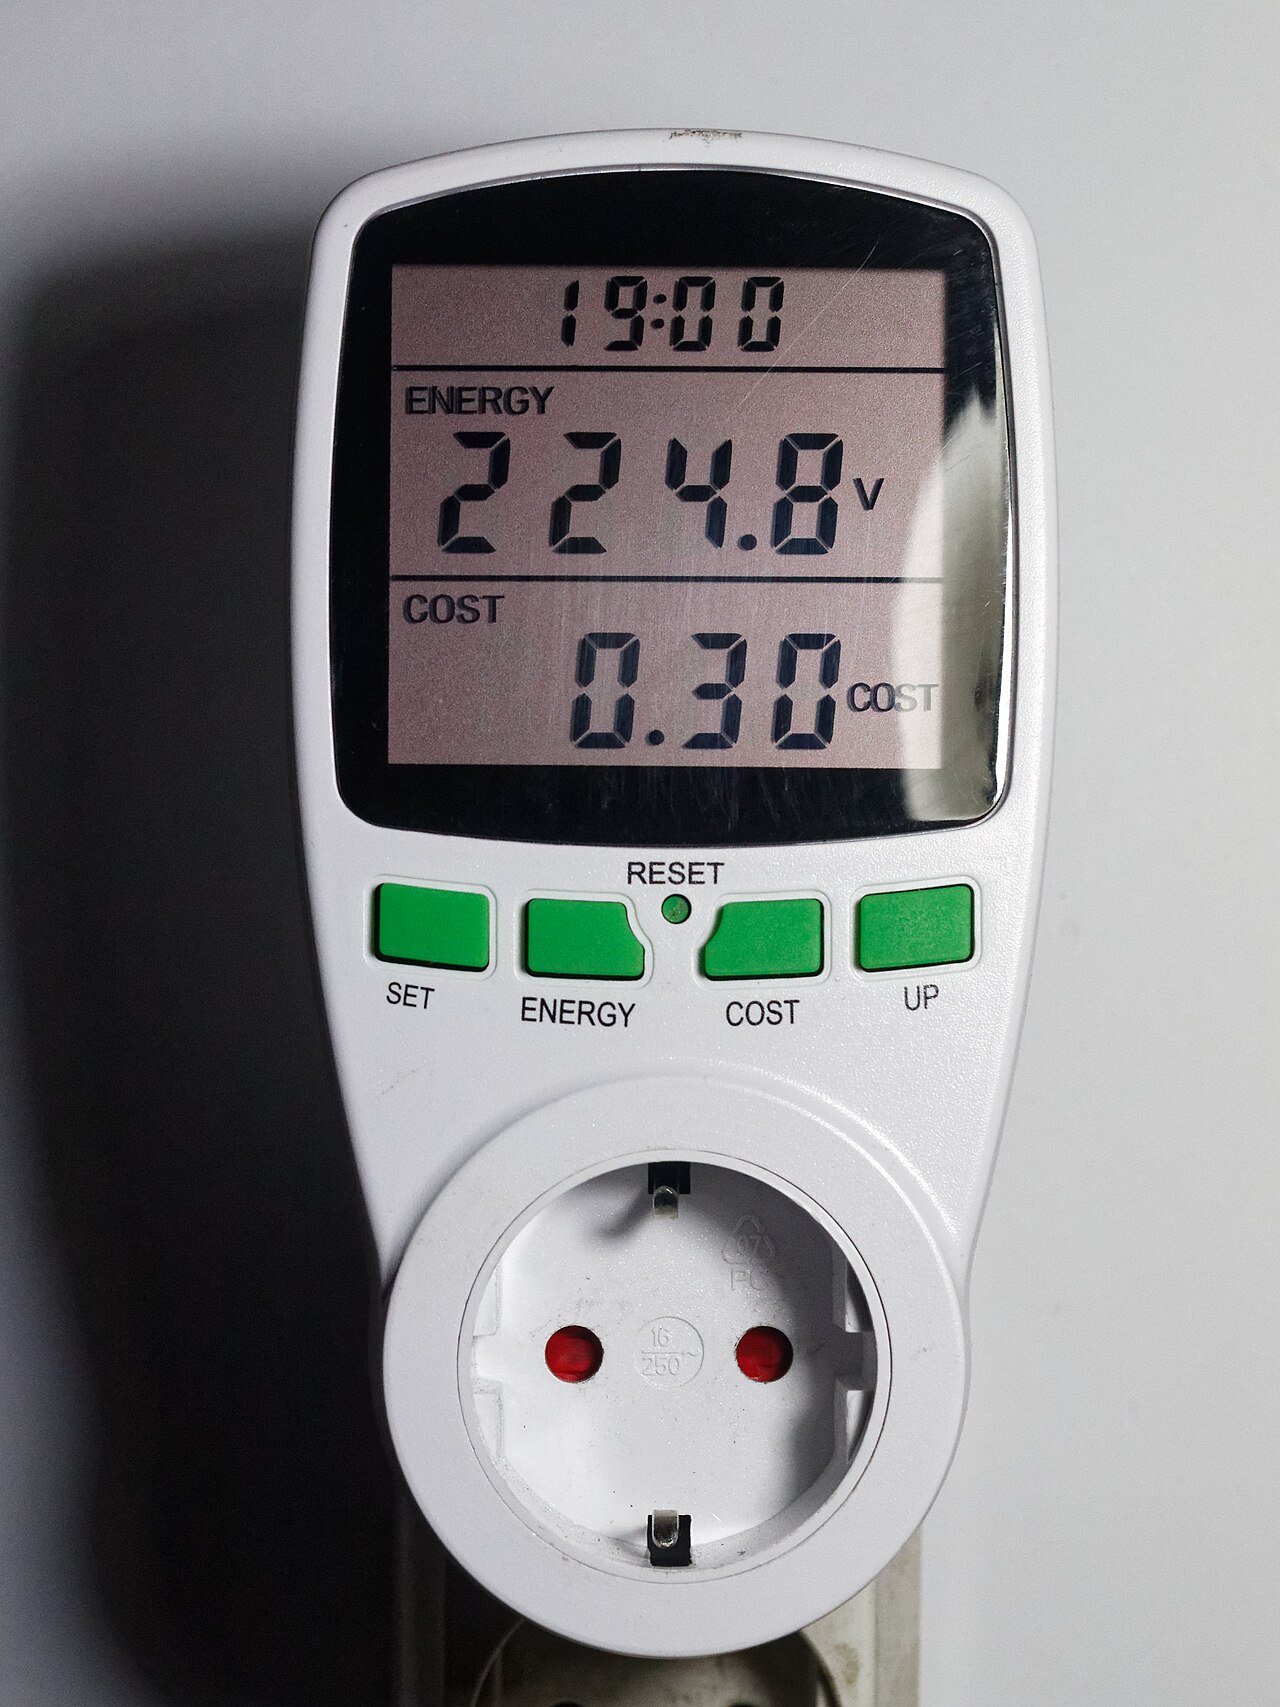
An appliance's live watt reading can change sharply while its energy use accumulates gradually. To describe average power across a period, divide the accumulated energy by the matching elapsed time. That can be more useful than choosing one dramatic moment from a cycling device's display.
Use only a compatible instrument within its documented ratings and intended conditions. Do not open equipment, move a heavy appliance unsafely or improvise adapters to make a measurement possible. This guide explains the record and calculation; it does not certify a household observation as a laboratory test.
Define the interval and the equipment boundary
Write down the device, model, operating mode and observation purpose. Identify whether the meter measures only that appliance or a group of devices. A power strip containing several products produces a group total unless the setup safely isolates the intended load within all instructions.
Choose an interval that includes representative operation for the question. A cycling appliance may need complete cycles, while a stable mode can use a different observation approach. Do not assume one hour represents a day or season without supporting evidence.
DOE FEMP — Measuring Standby Power explains the distinction between stable power readings and energy-based averaging for fluctuating low-power measurements. Its technical discussion is not a claim that an ordinary plug-in meter meets the relevant standard. Use the principle of matching energy and time while keeping the instrument's actual capabilities and the household conditions explicit.
Read the instrument's unit and counter behavior
Check the exact manual before starting. The P3 International — P4400 Operation Manual describes cumulative kWh and elapsed-time displays on one model. Other instruments may reset differently, retain data during outages or use different display precision. Follow the instrument you actually have.
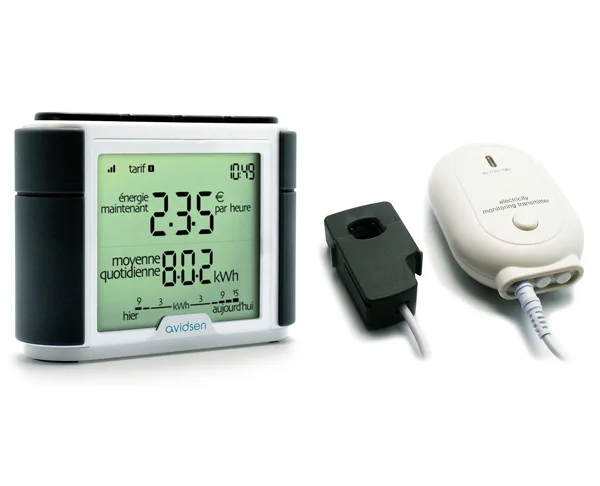
The monitor separates a currency-per-hour field from a daily-average kWh field. Copy each label with its number; an average or cost display is not automatically the cumulative energy counter needed for an interval calculation. Consult the exact instrument instructions for counter behavior, retained data and matched energy-and-time endpoints.
Photo & usage
Avidsen · CC BY-SA 3.0 · Source. Display copies resized and encoded as WebP; no instructional details were fabricated or removed.
Record starting energy and time counters or perform the documented reset if appropriate. Do not assume a zero display means all relevant counters have reset. Note any interruption or loss of power that could change the accumulation interval, and preserve the readings before disconnecting if the device loses them.
Keep instantaneous W, apparent-power VA and cumulative kWh distinct. A voltage screen is not an energy reading, and a product of volts and amps is not automatically the active watts you need. If the display mode is unclear, stop and consult the manual rather than assigning a plausible unit from the number's size.
- Check the actual instrument’s ratings, counter behavior and displayed unit before recording.
- Collect energy and elapsed time from the same uninterrupted or explicitly documented interval.
- Convert time to decimal hours and independently verify the average-power calculation.
Collect matching endpoints without changing the task
Operate the appliance normally within its instructions while the compatible meter records. Note mode changes, unusual use and interruptions. Avoid changing settings merely to generate a favorable number unless comparing those settings is the explicit purpose and the operation remains permitted.
At the end, record energy and elapsed time from the same accumulation period. If using differences between two nonzero readings, subtract both energy and time endpoints consistently. A new energy reading paired with an old timer creates a misleading average even when the arithmetic is correct.
EIA — Measuring Electricity distinguishes power from energy over time. Here, the conversion is average watts = kWh × 1,000 ÷ hours. Keep the units in the written formula. Hours and minutes need conversion to decimal hours before division; 2 hours 30 minutes is 2.5 hours, not 2.30 hours.
Work through an illustrative cycling-load record
All readings here are illustrative. An instrument accumulates 0.84 kWh over exactly 12 hours. Average power is 0.84 × 1,000 ÷ 12 = 70 W. A live reading during one active stage might be 180 W, while a quieter stage might be much lower.
Multiplying the 180 W snapshot by all 12 hours would predict 2.16 kWh, which differs from the illustrative accumulated 0.84 kWh. The snapshot describes that moment, not the interval average. The example does not establish a real appliance's duty cycle or identify why its power changes.
At an illustrative flat energy rate of USD 0.20 per kWh, the observed interval would correspond to USD 0.168 in energy charges, displayed as about USD 0.17. Extending the 70 W average to another period is a scenario requiring comparable operation. Do not label it a measured annual cost when only a twelve-hour interval supports the average.
Check whether the interval represents the intended question
Review the observation notes. Did a door remain open unusually long, did the device complete an update, or did the household use a different mode? Such events do not necessarily invalidate the data, but they change what the average represents.
Keep warm-up and idle periods according to the question being answered. A whole-session average should include them when they are part of ordinary use. A mode-specific average should not silently absorb unrelated activity. State the boundary instead of choosing whichever interval produces the most attractive result.
Repeat only when a material uncertainty remains, such as incomplete cycles or a missed interruption. More measurements are not automatically better if the operating conditions keep changing. Choose a representative interval and document its limits rather than accumulating disconnected snapshots that cannot be compared meaningfully.
Treat low readings and precision carefully
A display showing zero may mean the draw is below the instrument's resolution rather than exactly absent. Check accuracy and resolution information for the relevant range. Do not report hundredths of a watt merely because a spreadsheet can calculate them from coarsely rounded energy readings.
For a small accumulated quantity, rounding can have a large relative effect. A longer suitable interval may help only if the meter is capable of the measurement and conditions remain relevant. Time alone cannot cure an instrument whose specified accuracy is unsuitable for the task.
If the result is too uncertain to affect the decision, say so. A household record can conclude that the available meter cannot distinguish two low-power modes reliably. That is more useful than a precise-looking saving based on numbers near the display limit, especially when a purchase decision depends on the difference.
Audit the elapsed-time conversion independently
Time displays can be easy to misread when a meter alternates between hours and minutes or changes format for long intervals. Copy the displayed format and follow the exact manual. A spreadsheet should receive decimal hours only after that format is understood.
For an illustrative 0.30 kWh accumulated over 2 hours 30 minutes, the interval is 2.5 hours and the average is 120 W. Entering 2.30 hours would instead produce about 130.43 W, an arithmetic result based on the wrong duration. The energy reading would be unchanged, making the time error easy to overlook.
Cross-check start and end clock times where practical, allowing for documented interruptions and time-zone changes. If the meter timer and clock interval differ, investigate before choosing whichever gives the preferred result. The completion check is agreement about the observation boundary, not agreement between two calculations that both use the same mistaken decimal-hour entry.
Save the average with its supporting endpoints
Keep device identity, mode, start and end readings, elapsed hours, instrument model and relevant conditions together. Record the calculation and any exclusions. Another person should be able to reproduce the 70 W-style average from the original quantities without guessing the observation duration.
Write the conclusion at the interval's scale. It may support a session cost or a scenario for similar operation. It does not by itself establish yearly consumption, diagnose a fault or prove a manufacturer's label is wrong, since those can use different conditions and boundaries.
Completion means the energy and time match and the average is reported with honest scope. Preserve the raw endpoints even if the headline result is rounded. The reliable record explains both the number and the period of operation that gave it meaning.
THE REFERENCE FILE
Sources & scope
Documentation reviewed 1 Nov 2026. Examples are illustrative; this article does not claim hands-on product testing. Follow the instructions for your actual material, model and location.